COVID-19 and Urban Density: Is Long Beach at Risk?
19 minute readThe words in this essay belong solely to the author—but I hope you won’t let it stay that way. Reach out to me with ideas for art, stories, perspectives, solutions, and new politics: andrew@forthe.org. Alternatively, DM me on Instagram if that is more convenient: @oldschoolcarroll; or Twitter: @abolishprop13.
The prevalence of COVID-19 cases in America’s most populated city, New York, has led to worries that the density of cities has helped the virus spread. In Long Beach, some have taken the opportunity to criticize urban environments wholesale, advocating for cities to shun density in favor of more single-family communities. The Los Angeles Times published a recent op-ed arguing the same.
At first glance, it seems to make perfect sense that denser places would contribute more to COVID-19’s spread. If people are living closer together, wouldn’t they come into contact more often, and thus increase their odds of contracting and spreading the disease?
The World Bank responded to this exact question with a graph of coronavirus cases in Chinese cities per population as measured against density, and found a slight reverse correlation—i.e. the denser the city, the less cases.
Beyond the World Bank, anyone with access to the Worldometer website—which provides live, 24/7 COVID-19 updates—could also point out some large anomalies to the idea that diseases thrive in density. For instance, perhaps the densest city on earth—Hong Kong—presently has only 1,038 cases and four deaths. Shouldn’t Hong Kong, an incredibly populated urban environment, much closer to Wuhan than the United States, have experienced a worse fate?
Still, with the accuracy of official Chinese numbers coming into doubt, it may be good to look elsewhere. An analysis at CityLab found a much clearer correlation between COVID-19 cases in America and denser urban counties. But then, without consistent and widespread testing, we still don’t know how accurate American numbers are, either. Nor do we know what point different communities are at on their respective curves. Some places peaked early—maybe?—while rural America has lagged behind. But the virus now appears to be spreading there just as quickly.
It turns out that the movement of a virus through a population is a bit more complicated than any one factor, as many of us—forced so suddenly into the field of amateur epidemiology—have come to discover over the past few months. It’s not clear that density is correlated with higher case rates globally, but it does seem American cities are thus far bearing the worst of COVID-19’s spread.
At the same time, however, American cities are marked by many other defining factors beyond just a generalized density. Myriad socioeconomic differences could also be playing a role—and perhaps those roles are less obtuse than density, and would provide a better way of analysing the situation. Perhaps, when we talk broadly about density, we are still taking too large of a view.
The CityLab numbers referenced above leaned partly on a previous analysis of global data, which, while noting the struggles of cities with COVID-19, also cautioned the reader with a big problem in tracking this disease:
“What we find disappointing so far is the crude geography of most of the maps of Coronavirus in the US. The real geography is not that of states, or counties, but rather the particular locations—the homes, businesses, hospitals, hotels, restaurants, airplanes or cruise ships, where infected people interacted directly with the previously unaffected. These maps would provide a much more useful and accurate picture of the geography of Covid19…”
If that were the case, then the problem with the density equals disease hypothesis would not necessarily be its logic, but its lack of details. Cities, at a very abstract level, are dense—but that doesn’t tell us very much. And density could, or could not, equal disease, depending on what we mean by density. The more detailed we are about what density means—the more we zoom in to find where it occurs—the more we may begin to understand which communities are at increased risk during this pandemic, and why.
To make that trip, into the details of density, we’ll head first to New York, and then Singapore, before coming right back here, to Long Beach.
The Five Boroughs of New York
In the United States, the first urban environment to come to almost everyone’s mind is the city of New York.
New York is, to many of us, a completely abstract place. It is a city. It is dense. It has tall buildings, lots of traffic, subways, diversity. It is a magnet for cultural innovation and style. It is paradoxically wealthy and poor. It has all the characteristics we assume of a city in the abstract sense, including crime, corruption, people too busy to say hi to each other, and so on. Everything we think—true or false—about cities in general, we think is also true about New York.
Tragically, this seems doubly the case in the context of the ongoing pandemic, since the city has thus far acted as the American epicenter, reporting over 150,000 cases. Whatever you think about the coronavirus—true or false—New York can be a mirror for that, too.
But it is not always appropriate—and not necessarily very informative—to point to such a large place in such an abstract way, because envisioning New York as one homogeneous thing creates all sorts of contradictions within it.
For instance, that the city is somehow both poor and rich. How is that possible? Shouldn’t it be one or the other? We would expect a contradiction like that to disappear once we got a more detailed look at the city—once we stopped seeing it as one big uniform thing, and started seeing it as an innumerable amount of smaller, varied things.
Just taking one small step in that direction, and using this virus as an example, we can note that the densest borough of New York City is Manhattan. Indeed, Manhattan is one of the densest places to live on Earth. It is about twice as dense as Brooklyn and the Bronx, over three times as dense as Queens, and nearly nine times denser than Staten Island.
Despite this, Manhattan has the lowest rate of cases among the boroughs, while the Bronx rates highest. Thus, even in the very dense city of New York, we can immediately note that looking closer at its neighborhoods reveals a more complicated picture than density equals disease.
What could be one reason for the discrepancy? As CityLab put it:
“…there is a huge difference between rich dense places, where people can shelter in place, work remotely, and have all of their food and other needs delivered to them, and poor dense places, which push people out onto the streets, into stores and onto crowded transit with one another.” [emphasis in original text]
That might help explain case rates—but what about death rates? Staten Island has a large number of cases, but it and Manhattan are the two wealthiest boroughs by median income, and have combined for over 2,000 deaths.
Meanwhile, their three lower-income counterparts—Queens, Brooklyn, and the Bronx—have the three highest death counts in the entire country: over 9,600 members of these communities have lost their lives to this virus so far. Each of these boroughs is at least half as dense as Manhattan, yet they average over twice the deaths.
New York’s Furman Center released a study on April 10 summarizing this disproportionate impact with an important distinction:
“Finally, we find that areas with higher numbers of confirmed COVID-19 cases have lower population density, yet they do have higher rates of overcrowding at the household level.” [emphasis added]
This, unfortunately, makes sense. A city may have density, sure, but diseases don’t spread from city to city—they spread from person to person.
That might seem obvious when phrased like that; but then we also should accept its implications: city characteristics, like density, may not give us any convincing narratives about the comparative risks of infection and death from COVID-19. Density isn’t at the right scale of measurement.
Instead, household characteristics—existing at a more detailed scale—may explain things better.
Density or Crowding?
When we find density at the household level, we give it a more specific name: crowding. And crowding correlates with a lot of other household characteristics that, when taken together, form a whole web of socioeconomic disparities that may work to trap entire communities at once, exposing them to the worst of this virus. As the Furman Center analysis of New York City discovered:
“Neighborhoods with higher rates of confirmed COVID-19 cases have lower median incomes, higher shares of residents who are Black or Hispanic, and higher shares of residents under the age of 18 relative to less affected neighborhoods. Residents of these neighborhoods are less likely to be able to work from home, disproportionately rely on public transit during the crisis, and are less likely to have internet access.”
The New Yorker shared several tragic stories from the perspective of a physician in Queens, who has seen “how closely socioeconomic status is tied to the disease.” Some neighborhoods have longer lines, less ventilators, less testing, and more deaths.
On Sunday, Los Angeles County released information describing many of these same disparities:
“Overall, black people continue to see the highest COVID-19 death rate in L.A. County, with 13 deaths per 100,000 people, compared with 9.5 for Latino people, 7.5 for Asian people and 5.5 for white people…”
Public health officials concluded that those with lower incomes have been three times more likely to die:
“Neighborhoods where 30% to 100% of residents live in poverty have seen about 16.5 deaths per 100,000 people, compared with 5.3 deaths per 100,000 people in communities where less than 10% of residents live in poverty, they said.”
Connecting these situations back to crowding, a 2017 report from the California Department of Human Health concluded, “Residential crowding reflects demographic and socioeconomic conditions,” and, relevant to today’s struggles, noted:
“Residential crowding has been linked to an increased risk of infection from communicable diseases [and] a higher prevalence of respiratory ailments…”
Yes, crowding may prove a much better lens for understanding which communities are most at risk in the present crisis. And the reader can likely think of immediate examples where the crowding lens proves clarifying.
Along with overcrowded households in specific New York City neighborhoods, we have seen disproportionate numbers of cases in: Pacific Ocean cruise ships, where some of the first outbreaks outside mainland China occurred; American meatpacking plants, where infection rates are higher than 75% of U.S. counties; a New York prison, where hundreds have been infected; two more in Ohio, where roughly 80% of inmates tested positive for the virus; U.S. nursing homes, where over 7,000 have died so far; and so on…
If six feet of separation really is enough to slow the spread of COVID-19, then of course a metric like density—operating at a geography much, much larger than six feet—would tell us almost nothing about how it spreads.
But crowding, almost by definition, tells us where people are packed within six feet of each other. And if the same folks who suffer overcrowding are also likely to lack a range of other privileges, then they would constitute the communities most likely to not just spread the virus quickly among themselves should any member of the community contract it, but also pay the greatest price.
Migrants in Singapore
Tomisin Oluwole
Ode to Pink II, 2020
Acrylic and marker on paper
14 x 22 inches
Click here to check out our interview with Tomisin Oluwole, a a literary and visual artist based in Long Beach.

Instead of gunking up our site with ads, we use this space to display and promote the work of local artists.
To clarify with an ongoing example, let’s look at the recent outbreak of COVID-19 within one such overcrowded community.
Over the past week, Singapore—an early success story in combating the virus—has suddenly faced a surging number of cases: almost 15,000 at the time of this writing.
Though much less dense than New York City on average—Singapore’s density per square mile is closer to Queens than Manhattan—it is still quite dense, and so it is still quite tempting at first glance to blame urban density for the sudden outbreak.
But, much like with New York, this would involve leaving out some of the specifics.
The BBC reported 80% of the new cases in the city-state have been traced back to dormitories where migrant workers are packed by the thousands. According to an interview with one of the workers, “15 to 20 people, even more” can live in one room; and everything is shared, from canteens to showers to toilets.
In a daily update from Singapore’s Ministry of Health this past Thursday, it announced six more clusters of the outbreak, all connected to dormitories. In particular, “The S11 Dormitory in Punggol remains Singapore’s largest active cluster with 2,234 confirmed cases. The cluster accounts for almost 20 percent of all the cases here.”
And it turns out that crowded dormitories suffering disproportionately from an infectious disease was predictable:
“Long before the first coronavirus cluster emerged in a dormitory, migrant rights groups in Singapore like Transient Workers Count Too (TWC2) and the Humanitarian Organisation for Migration Economics (HOME) were already highlighting issues with overcrowded, unsanitary, and otherwise substandard living conditions. As HOME’s operations manager Luke Tan told me: ‘In terms of social humanitarian reasons, we already mentioned something like this [a virus outbreak] is like a disaster waiting to happen.'”
Far from being an argument against the alleged problems of dense city life, Singapore shows that even a robust and much-applauded public health approach to fighting the coronavirus can have fatal cracks if it fails to account for all of its population—i.e., every single human being, including and especially migrants living or working in crowded conditions.
Is Long Beach at Risk?
And this brings us back to Long Beach.
The city organized a teleconference on Sunday to discuss the impact of COVID-19 on black communities here. The most-recent data for Long Beach shows black communities have disproportionately higher case and hospitalization rates, while Latinx communities have the total highest numbers of each. Newly appointed City Manager Tom Modica explained one of the connecting issues:
“We also know in very dense communities, not everyone has the luxury of having an extra bedroom that they can isolate and quarantine in. They may live in a household with many other people, some of whom have underlying health conditions.”
The city’s most recent data states, “12.2 percent of all households in the City are experiencing overcrowding,” and that the areas with the highest rates of overcrowding are also the “socioeconomically disadvantaged communities with fewer affordable housing options…”
That same report informs us, “California’s Department of Housing and Community Development defines ‘overcrowding’ as a household with more than one person per room and ‘severe overcrowding’ as more than 1.5 persons per room.”
For comparison, 2015 data shows the San Francisco and New York metropolitan areas have around 6% overcrowding—or about half the amount of Long Beach.
A 2014 map produced by the city, using data from the most recent Census, provides a clear image of where “severe overcrowding” takes place: some downtown tracts have over 20% of renter households experiencing severe overcrowding, with one Westside tract reporting over 50%.
These are the places and situations where we would expect any outbreak to be hardest to contain, and to impact the most people. But I hope it’s clear that we shouldn’t blame density. A Beacon Economics report from 2018, which looked at Long Beach’s projected future housing needs, observed that only 0.3% of the city can be considered “high density.” (pg. 23) So while Long Beach is very overcrowded, it is actually not very dense.
How’d We Get Here?
In the 2017 report on household crowding, the California Department of Human Health tied overcrowding back to its many interrelated factors:
“Older-adult immigrant and recent immigrant communities, families with low income and renter-occupied households are more likely to experience household crowding.”
Given that Long Beach is consistently ranked as having among the highest shares of renters in the nation, one of the most direct paths to alleviating the city’s crowding issues may be to support its large renter population, and/or build enough affordable housing.
Unfortunately, the City Council has thrown almost all its weight on the other end of the scale. The 2012 Downtown Plan fast-tracked developments and included no affordable housing provisions. As a result, luxury developments have sprouted up in the downtown area, replacing existing units and displacing existing tenants. This has further contributed to an atmosphere of rent-seeking, which has led to the kind of speculative rent-gouging and apartment-gutting that continues to plague the city. A study released late last year showed that, until a global pandemic came along, Long Beach was the third worst city in the nation when it came to how much rents have increased as measured against median income.
Aside from facilitating these conditions, the city has also struggled to protect existing affordable housing. Though the city claims that from 2007 to 2017 it built almost 1,700 affordable units, the aforementioned Beacon Economics report showed that from 2010 to 2016, Long Beach lost almost 6,000 housing units, affordable or otherwise. (pg. 4)
How is it possible to lose housing in the middle of a housing boom? It may be due to the fact that our city’s leaders have dedicated themselves time and time again to building the wrong kind of housing—either making housing unaffordable, and/or making it less dense.
Combine negligent construction priorities with a free rein to deconstruct and renovate existing housing, and you can create a net loss of housing stock. The Beacon report ran the numbers, and concluded that for every one unit of housing Long Beach gained from 2010 to 2016, it lost 2.37 units. (pg. 5)
A draft of the report summarized the city’s tactics with a tangible disbelief:
“…the entire sequence of decision making from planning to permitting to building successively reduces the number of parcels that may be developed, and in turn, the number of housing units that may be delivered to meet the needs of the City’s residents.” (pg. 10)
And the city observed the same logic in one of its own reports last year:
“…there are currently only 12,951 rental units in the City that contain three or more bedrooms. The existing imbalance between available large housing units and the demand for such units has ultimately resulted in overcrowding conditions and explains the discrepancy between the City’s high household growth rates and its relatively low population growth rate.” (sec. 4.6-6) [emphasis added]
Despite this welcome analysis, the City Council has been demonstrably hesitant to address the problem. The Beacon report we’ve been discussing was released in January of 2018, but that didn’t stop the City Council just two months later from passing a revised Land Use Element—a guide for future development in the city—that approved adding single-family housing to every district in the city at the direct expense of multi-family housing. (pg. 57)
You can read my critique of the Land Use Element from March 2018, before it was passed, where the concerns for the impact this would have on affordability and displacement were well-documented by an external analysis. Not only has the City Council been further suburbanizing Long Beach at a time when California’s housing needs are at an all time high, it also approved land use guidelines for Long Beach’s First and Second Districts that set the stage for multi-family units to potentially be replaced with single-family housing, despite these being the two districts where overcrowding is at its highest.
This concerted, near-decade-long campaign—from the Downtown Plan of 2012 to the Land Use Element of 2018—has worked to place residents at acute risk of the spread of infectious disease; and while no person or institution or decision or factor should be solely blamed for a global pandemic, we can and should hold our city’s leaders accountable for maintaining what may be one of the largest risk factors for its spread.
Seeing the Invisible
This all directs us to a somewhat ironic solution: increasing density will actually decrease crowding; and it’s crowding, not density, that we should look to first when accounting for the varied and multiple risk factors of COVID-19.
So when we think of disease, we shouldn’t envision tall buildings and busy streets and foot traffic. We shouldn’t bring to our mind’s eye pointed skyscrapers and tight alleyways and bustling markets. We shouldn’t think of cities in the abstract sense. We shouldn’t think of density.
We should instead imagine the specific instances where crowding happens. We should think of where crowding is the most problematic. We should think of where crowding is, paradoxically, the least visible.
Think of migrant dorm rooms stuffed with bunk beds.
Think of industrial plants and factories, such as the bakery we reported on last week, with packed employees working shoulder-to-shoulder.
Think of the world’s livestock industries, which pile animals nearly on top of each other in an endless quest to more efficiently profit from cheap food.
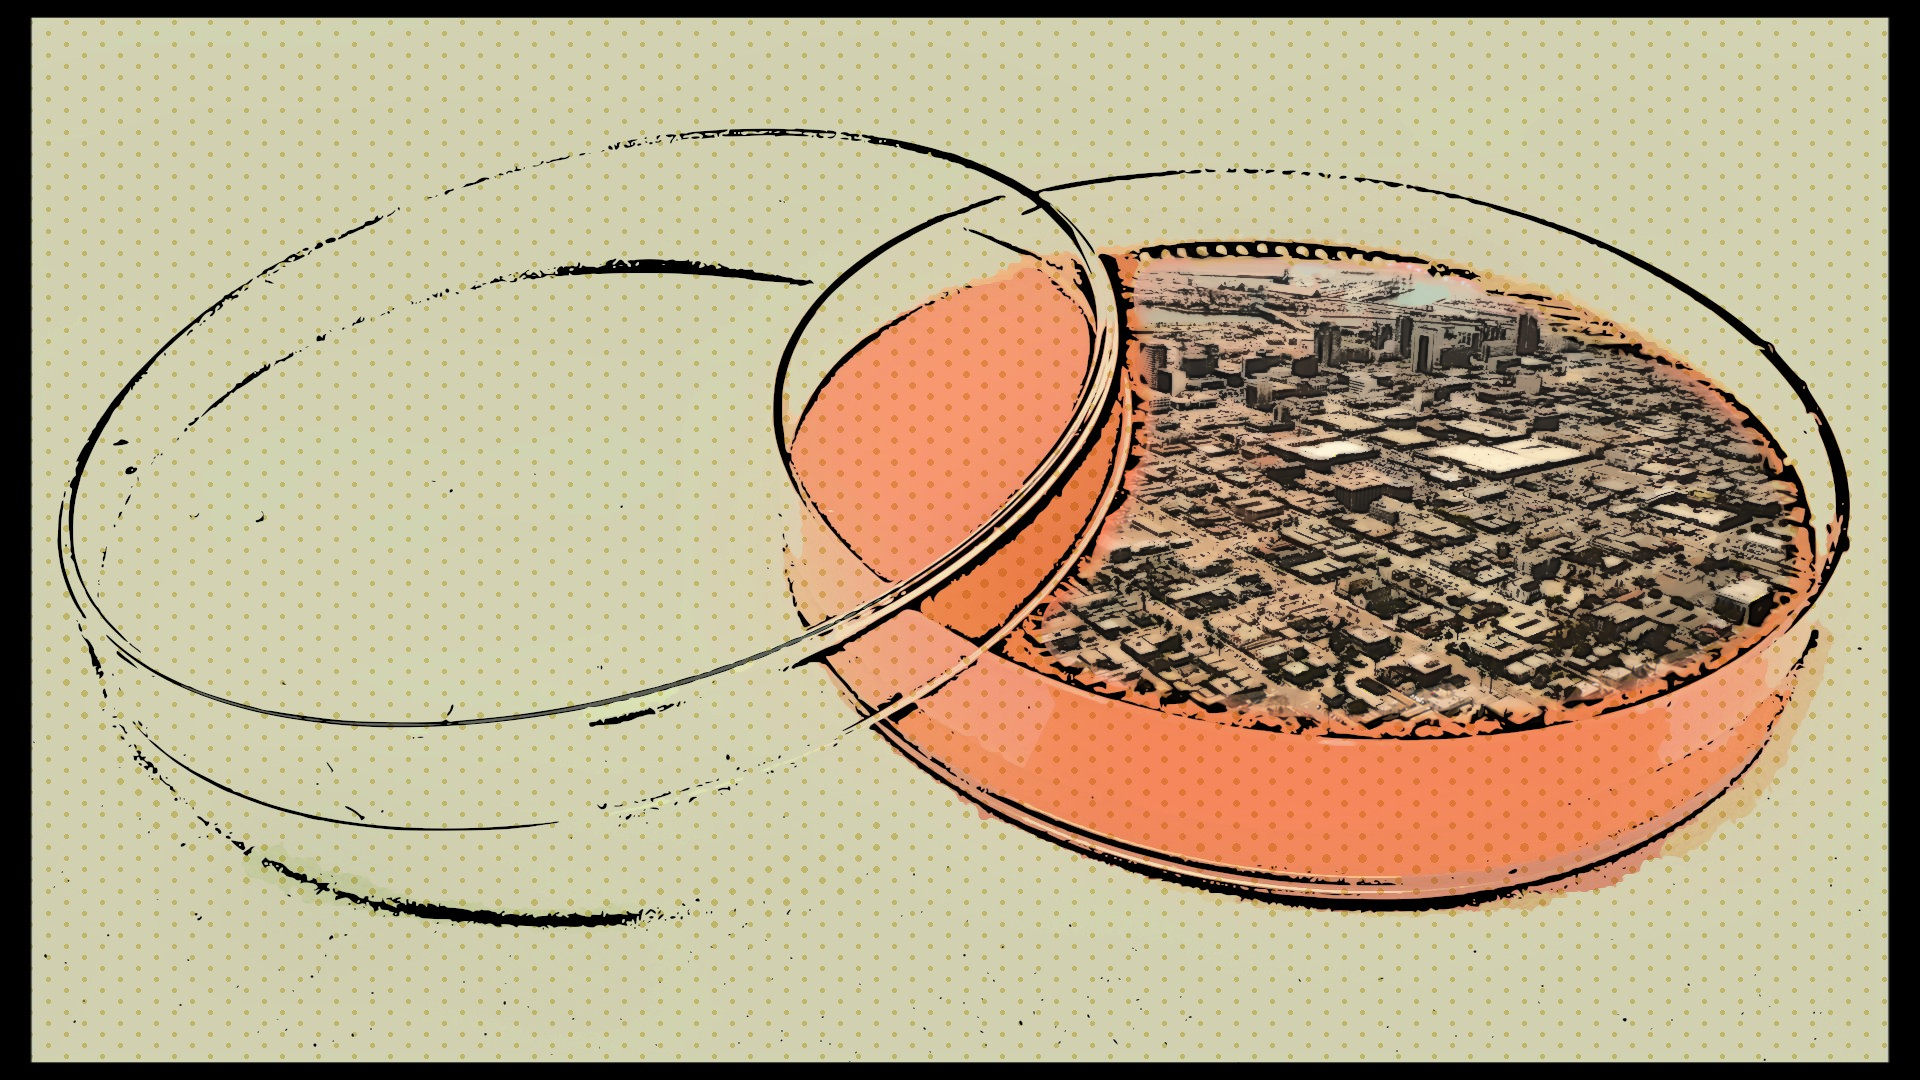
Think of how the practices of those industries create the petri dishes of bacteria, filth, and stress that lead to the vast majority of emergent diseases in the human population to begin with.
Think of all these industries—whether they employ humans or animals or both—ignoring the health of their workers, their environments, their consumers.
Think of the burdens of having to accept crowded working and housing conditions so you can afford to simply exist somewhere.
And lastly, think of the crowded renter-occupied homes of our own city.
 andrew@forthe.org